Monitor a VMware vSphere server with Nagios3 on Debian Wheezy
I wrote down some notes about configuring Nagios to check the health status of a few VMware vSphere ESXi 5.1.0 servers. First of all, install the required packages on the Nagios server:
apt-get install libssl-dev perl-doc libxml-libxml-perl libxml2-dev uuid-dev
now get and install perl UUID package:
cd /usr/src
wget http://search.cpan.org/CPAN/authors/id/J/JN/JNH/UUID-0.04.tar.gz
tar -xzvf UUID-0.04.tar.gz -C /opt
cd /opt/UUID-0.04
perl Makefile.PL
Then we need to download VMware-vSphere-Perl-SDK-5.1.0-780721.x86_64.tar.gz (download the i386 version if your system is 32 bits) (note: you need to register in order to download it)
https://my.vmware.com/group/vmware/details?downloadGroup=VSP510-SDKPERL-510&productId=285
Download it on (or transfer it to) the Nagios server, then unpack and install:
tar zxvf VMware-vSphere-Perl-SDK-5.1.0-780721.x86_64.gz -C /opt/
cd /opt/vmware-vsphere-cli-distrib/
Even if you don’t sit behind a proxy, you must export these or it won’t work (damn!):
export http_proxy=
export ftp_proxy=
echo ubuntu > /etc/tmp-release
./vmware-install.pl
Just select /usr/bin/ and ignore warnings If everything is ok (hope so), we may continue by getting the plugin “check_vmware_api.pl” from:
http://git.op5.org/git/?p=nagios/op5plugins.git;a=tree
I had to edit it to avoid problems with unsigned certificates (damn!):
$ENV{PERL_LWP_SSL_VERIFY_HOSTNAME} = 0;
Now copy the edited plugin check_vmware_api.pl to /usr/lib/nagios/plugins/check_esx and we are ready to start testing:
/usr/lib/nagios/plugins/check_esx -H ${YOUR_VMWARE_ESXi_IP_ADDRESS} -u ${YOUR_VMWARE_USERNAME} -p ${YOUR_VMWARE_USER_PASSWORD} -l runtime -s status
CHECK_ESX OK - overall status=green
Great, it works! Once you successfully tested the plugin, you may create some Nagios template recipes for your vmware monitored servers: For example I can define an hostgroup for vmware in /etc/nagios3/conf.d/vmware-host_nagios2.cfg:
define hostgroup{
    hostgroup_name  vmware-esxi ; The name of the hostgroup
	alias           VMware ESXi Servers ; Long name of the group
	members         vmw01,vmw02     ; Comma separated list of hosts that belong to this group
}
Assuming that all my vmware servers share the same read-only monitoring dedicated user (eg. “monitoring”) with same password, we may define vmware’s username and password as variables in /etc/nagios3/resource.cfg as follows:
$USER9$=monitoring
$USER10$=My_(Not_AnyM0re)_$ecret_Passw0rd
Now we can define a vmware dedicated service group and related check-commands in /etc/nagios3/conf.d/vmware-service_nagios2.cfg:
# generic service template definition (slightly modified)
define service{
	name                vmware-service 		; The 'name' of this service template
	hostgroup_name      vmware-esxi			; The 'name' of the hostgroup
	active_checks_enabled           1       ; Active service checks are enabled
	passive_checks_enabled          1       ; Passive service checks are enabled accepted
	parallelize_check               1       ; Active service checks should be parallelized (disabling this can lead to major performance problems)
	obsess_over_service             1       ; We should obsess over this service (if necessary)
	check_freshness                 0       ; Default is to NOT check service 'freshness'
	notifications_enabled           1       ; Service notifications are enabled
	event_handler_enabled           1       ; Service event handler is enabled
	flap_detection_enabled          1       ; Flap detection is enabled
	failure_prediction_enabled      1       ; Failure prediction is enabled
	process_perf_data               1       ; Process performance data
	retain_status_information       1       ; Retain status information across program restarts
	retain_nonstatus_information    1       ; Retain non-status information across program restarts
	notification_interval           0		; Only send notifications on status change by default.
	is_volatile                     0
	check_period                    24x7
	normal_check_interval           5
	retry_check_interval            1
	max_check_attempts              4
	notification_period             24x7
	notification_options            w,c ; just notify for warning and critical states
	contact_groups                  admins
	register                        0       ; DONT REGISTER THIS DEFINITION - ITS NOT A REAL SERVICE, JUST A TEMPLATE!
	### I also like the pnp4nagios plugin :)
	action_url /pnp4nagios/index.php/graph?host=$HOSTNAME$&srv=$SERVICEDESC$' class='tips' rel='/pnp4nagios/index.php/popup?host=$HOSTNAME$&srv=$SERVICEDESC$
}

#### VMware ESXi 5 check commands:
# check vmware esxi machine
# check cpu

define command{
		command_name check_esx_cpu
		command_line $USER1$/check_esx -H $HOSTADDRESS$ -u $USER9$ -p $USER10$ -l cpu -s usage -w $ARG1$ -c $ARG2$
		# we pass the vmware credentials as USER9 and USER10 variables, as defined in /etc/nagios3/resource.cfg
		}

# check memory usage
define command{
		command_name check_esx_mem
		command_line $USER1$/check_esx -H $HOSTADDRESS$ -u $USER9$ -p $USER10$ -l mem -s usage -w $ARG1$ -c $ARG2$
		}

# check net usage
define command{
		command_name check_esx_net
		command_line $USER1$/check_esx -H $HOSTADDRESS$ -u $USER9$ -p $USER10$ -l net -s usage -w $ARG1$ -c $ARG2$
		}

# check runtime status
define command{
		command_name check_esx_runtime
		command_line $USER1$/check_esx -H $HOSTADDRESS$ -u $USER9$ -p $USER10$ -l runtime -s status
		}

# check io read
define command{
		command_name check_esx_ioread
		command_line $USER1$/check_esx -H $HOSTADDRESS$ -u $USER9$ -p $USER10$ -l io -s read -w $ARG1$ -c $ARG2$
		}

# check io write
define command{
		command_name check_esx_iowrite
		command_line $USER1$/check_esx -H $HOSTADDRESS$ -u $USER9$ -p $USER10$ -l io -s write -w $ARG1$ -c $ARG2$
		}
Then we may use the above commands on a actual vmware host definition (ie. /etc/nagios3/conf.d/vmw01.cfg):
# Host vmw01
define host{
        use                     vmware-host
        hostgroups              vmware-esxi
        host_name               vmw01
        alias                   VMWare ESXi VMW01
        address                 10.10.10.23  ; you may want to put here your actual IP :)
        }

# Define a service to “ping" the local machine
define service{
        use                             vmware-service
        host_name                       vmw01
        service_description             PING
        check_command                   check_ping!100.0,20%!500.0,60%
        }

# VMWare
# check cpu
define service{
        use                             vmware-service
        host_name                       vmw01
        service_description             ESXi CPU Load
        check_command                   check_esx_cpu!80!90
        }

# check memory usage
define service{
        use                             vmware-service
        host_name                       vmw01
        service_description             ESXi Memory usage
        check_command                   check_esx_mem!80!90
        }

# check net
define service{
        use                             vmware-service
        host_name                       vmw01
        service_description             ESXi Network usage
        check_command                   check_esx_net!102400!204800
        }

# check runtime status
define service{
        use                             vmware-service
        host_name                       vmw01
        service_description             ESXi Runtime status
        check_command                   check_esx_runtime
        }

# check io read
define service{
        use                             vmware-service
        host_name                       vmw01
        service_description             ESXi IO read
        check_command                   check_esx_ioread!75!90
        }

# check io write
define service{
        use                             vmware-service
        host_name                       vmw01
        service_description             ESXi IO write
        check_command                   check_esx_iowrite!75!90
        }
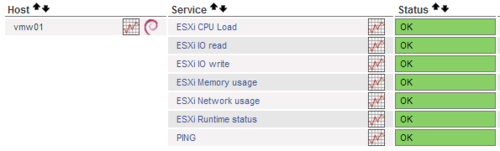
Reload the nagios service and enjoy:
/etc/init.d/nagios3 reload
Endlich, I would like to point you to these helpful resources I got inspiration (and unvaluable help) from:
https://www.feub.net/2010/12/monitoring-vmware-esxi-and-vsphere-with-nagios/ https://www.op5.org/community/plugin-inventory/op5-projects/check-esx-plugin https://www.op5.com/how-to/how-to-install-vmware-vsphere-sdk-perl-5-1/ https://www.sysadminslife.com/linux/vmware-vsphere-sdk-for-perl-api-unter-debian-squeeze-installieren/